
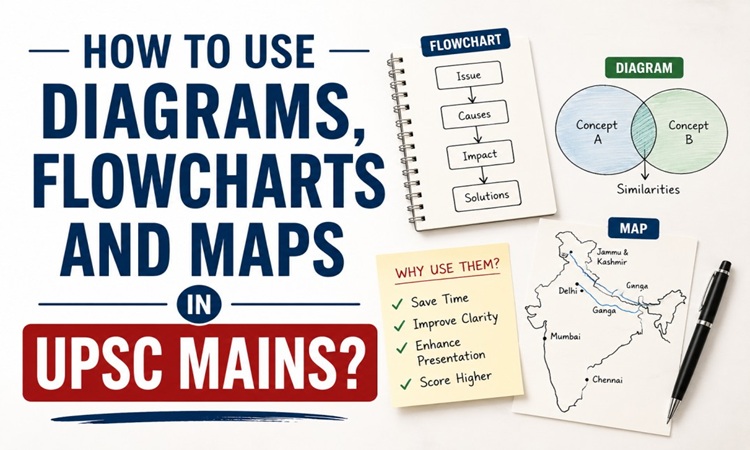
Learn how to use diagrams, flowcharts, and maps in UPSC Mains answers to simplify concepts, impress examiners, build a diagram bank, and boost your GS scores. The UPSC Civil Services Mains Examination is a descriptive exam where answer presentation is as important as subject knowledge. A well-structured answer that combines quality content with effective visual representation often attracts better marks. Using diagrams, flowcharts, and maps helps explain complex ideas quickly, improves readability, and makes your answers more engaging for the examiner. These visual tools demonstrate conceptual clarity and analytical thinking while reducing the need for lengthy explanations. However, they should always support your written answer rather than replace it. UPSC aspirants preparing with Vajirao & Reddy Institute, one of the Top IAS coaching in Delhi, regularly practice incorporating diagrams and flowcharts into their answer writing to improve presentation and maximize scores in the UPSC Mains Examination.
Why are Diagrams, Flowcharts and Maps Important in UPSC Mains?
Score higher in UPSC Mains by using simple diagrams, flowcharts, and maps. Learn to build a diagram bank, draw India maps quickly, and improve GS answer presentation. Diagrams, flowcharts, maps, tables and graphs are powerful tools for enhancing the quality of UPSC Mains answers. They break the monotony of lengthy paragraphs, improve the presentation of your answers, and demonstrate conceptual clarity. Since the UPSC exam evaluates hundreds of answer sheets, well-designed visuals help them understand your arguments quickly and leave a positive impression. When used appropriately they make answers more engaging, analytical, and scoring.
Benefits of Using Diagrams, Flowcharts, and Maps in UPSC Mains
Using diagrams, flowcharts and maps in UPSC Mains helps present complex ideas in a simple, structured, and visually appealing manner. They reduce the need for lengthy explanations, save valuable time during the examination, and make answers easier for examiners to evaluate. Well-designed visuals demonstrate conceptual clarity, improve readability, and highlight key points effectively. Since the human brain processes visual information much faster than text, incorporating relevant diagrams and maps can make your answers more impactful and increase your chances of scoring higher marks in the UPSC Mains Exam. Let’s Benefits of using Diagrams, Flowcharts and Maps in UPSC Mains:-
Save Time and Improve Efficiency:
Visuals communicate a large amount of information in a concise format. Instead of writing lengthy explanations a simple flowchart or diagram can present the same idea in less time and within the prescribed word limit.
Enhance Clarity and Logical Presentation:
Flowcharts are ideal for explaining processes, cause-and-effect relationships, and policy implementation. For example, they can clearly illustrate how a bill becomes a law, the disaster management cycle, or the policy-making process.
Strengthen Geography and International Relations Answers:
Maps are particularly useful in Geography, Environment, and International Relations. They help depict border issues, trade routes, important river systems, strategic locations, and resource distribution with precision.
Present Data Effectively:
Tables, graphs, and charts simplify complex data and make comparisons easy. They are especially valuable in Economics, Governance, and Social Issues, where statistics and trends can be presented in an organized and easy-to-understand manner.
Make Your Answers Stand Out:
A neatly drawn diagram, boxed flowchart, or labelled map creates a visual break from continuous text. This improves readability, attracts the examiner’s attention, and makes your answer more memorable compared to conventional text-heavy responses.
Where Should You Use Diagrams in UPSC Mains Answers?
Using diagrams in UPSC Mains answers is an effective way to save time, improve presentation, and capture the examiner’s attention. Simple flowcharts can explain processes and policy implementation, Venn diagrams can illustrate similarities and differences between concepts, while cycle diagrams are useful for depicting continuous or recurring events. Keep every diagram neat, clearly labelled, and directly relevant to the question. Avoid spending more than one minute on a visual, ensuring it enhances your answer without affecting overall time management. Well-crafted diagrams make your responses more structured, visually appealing, and easier for the examiner to evaluate. Diagrams can be used across various General Studies papers and UPSC optional subjects wherever a concept can be explained visually. Let’s use them in the following specific areas:-
Geography- Physical and Human Geography
Use diagrams to explain topics such as plate tectonics, volcanoes, cyclones, river systems, ocean currents, monsoon mechanisms, soil formation, and climatic processes. A simple sketch often conveys these concepts more effectively than lengthy explanations.
Environment and Ecology- Ecological Processes
Illustrate food chains, food webs, ecosystems, biodiversity conservation, carbon cycles, water cycles, and climate change using neat diagrams to improve conceptual understanding.
Economy- Economic Models
Economic concepts like inflation, fiscal deficit, GDP growth, circular flow of income, demand and supply, and financial inclusion become easier to explain through flow diagrams and simple charts.
Science and Technology- Technology Frameworks
Topics such as Artificial Intelligence, Blockchain, Biotechnology, renewable energy, satellites, and digital governance can be represented using block diagrams and process flowcharts.
Governance and Social Issues- Administrative Frameworks
Governance models, stakeholder mapping, policy implementation, social justice, and public service delivery can be explained effectively using conceptual diagrams.
How to Use Flowcharts Effectively in UPSC Answers
Flowcharts are an excellent way to present information in a concise and visually appealing format in UPSC Mains answers. They simplify lengthy explanations by breaking complex ideas into short, easy-to-understand steps. Use flowcharts to explain processes, cause-and-effect relationships, policy implementation, decision-making frameworks, or life cycles. Keep the design simple by using neatly drawn boxes connected with arrows, and limit each box to 3–5 relevant keywords. Since the flowchart already conveys the key information, avoid repeating the same points in the main text. This approach saves time, improves answer presentation, and helps the examiner grasp your arguments quickly. Let’s exactly when and how to use them:-
Explaining Processes
Flowcharts help organize information in a logical sequence and are particularly useful when explaining processes, causes, effects, or implementation mechanisms. Use flowcharts in the UPSC Mains to break up long text and show cause-and-effect. Draw them to display processes, hierarchical structures, or multi-dimensional issues. Only use flowcharts when they save time, compress information and add actual value to your answer.
Showing Cause and Effect Relationships
Flowcharts work well for constitutional amendments, government schemes, disaster management cycles, policy implementation, environmental issues, and administrative reforms. For example, while explaining climate change, you can present the sequence from greenhouse gas emissions to global warming, rising temperatures, melting glaciers, sea-level rise, and climate disasters through a simple flowchart instead of lengthy paragraphs.
Presenting Solutions
Flowcharts are also useful for presenting recommendations and policy measures in a structured manner, especially in governance and ethics answers.
How to Use Maps in UPSC Mains Answers
Maps are among the most effective visual tools in Geography, International Relations, Disaster Management, Environment, and Internal Security. Draw simple freehand outline maps of India or the world wherever they add value to your UPSC Mains answer. Instead of placing maps at the end, integrate them within the relevant part of the answer to support your arguments. Practice drawing basic maps in 30-40 seconds so they do not consume valuable exam time. Keep your maps small, neat, and easy to understand, and clearly label important countries, states, rivers, mountain ranges, cities, or strategic locations as required by the question. Avoid using unnecessary details or decorative elements. Since map stencils are not permitted in the UPSC Mains Examination, regular freehand practice is the best way to improve speed, accuracy, and presentation. Let’s see How to Use Maps in UPSC Mains Answers:-
Indian Geography
Draw rough maps to indicate rivers, mountain ranges, mineral belts, industrial corridors, agricultural regions, cyclone-prone areas, and biodiversity hotspots. Indian Geography is a vital component of the UPSC Mains GS Paper 1 (GS I) syllabus. It assesses an aspirant’s understanding of India’s physical geography, climate, river systems, natural resources, agriculture, industrial regions, environmental issues, and disaster management. Practicing previous year question papers helps candidates understand the nature of the exam, improve answer-writing skills, and identify frequently asked topics in Indian Geography.
International Relations
Simple world maps help explain border disputes, maritime routes, geopolitical conflicts, regional organizations, and India’s strategic interests. Using maps in International Relations (IR) answers for the UPSC Mains can increase your score by 1 to 1.5 marks per question
Disaster Management
Maps can highlight earthquake zones, flood-prone regions, cyclone tracks, drought-affected areas, and vulnerable coastal regions. Maps are critical for securing high scores in Disaster Management (GS Paper 3) in the UPSC Mains. Including maps transforms abstract theoretical points into concrete, spatially aware arguments, directly demonstrating your analytical clarity to the examiner.
How to Practice Visual Presentation for UPSC Mains
Regular practice is essential to master the use of diagrams, flowcharts, and maps in UPSC Mains.
Build Daily Habits
Draw one India map every day, prepare flowcharts for important current affairs topics, convert newspaper editorials into visual notes, and review topper answer copies to understand how diagrams are effectively integrated into answers. Practicing under timed conditions helps improve speed, accuracy, and confidence.
Conclusion
Diagrams, flowcharts, and maps are powerful presentation tools that can significantly enhance the quality of your UPSC Mains answers. They simplify complex concepts, improve readability, and demonstrate conceptual clarity, making it easier for the examiner to understand your arguments. However, they should always complement well-written content rather than replace it. Vajirao & Reddy Institute, recognized as one of the best IAS coaching institutes in Delhi, emphasizes answer presentation alongside content quality. Through daily answer writing practice, expert evaluation, and personalized mentorship, aspirants learn how to use diagrams, flowcharts, and maps effectively to improve clarity, analytical presentation, and overall scores in the UPSC Mains Examination. Consistent answer writing practice with Vajirao & Reddy Institute helps candidates develop this essential skill and improve their chances of success in the UPSC Civil Services Examination.
